Fig. 4
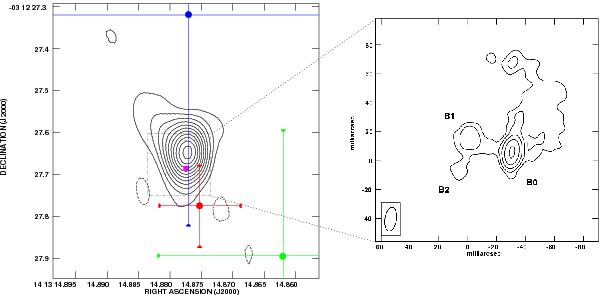
Left panel: VLA A-array K-band continuum image of the nuclear region of NGC 5506. Contour levels are –1, 1, 2, 3, 4, 5, 6, 7, 8, 9, 10, 11 × 2.1 mJy beam-1 (1σ rms = 0.7 mJy beam-1). The beam size is 0 12 × 008. We show the positions of the optical center (blue circle, taken from Adelman-McCarthy et al. 2008), water maser emission in our VLA DnC-array (green circle) and VLA A-array (red circle) maps, respectively. The size of the bars indicates the uncertainty in the positions derived. The dotted-dashed square indicates the area covered by the VLBI map of Middelberg et al. (2004) and the magenta square the position of the brightest source, B0, in this map. Right panel: the EVN and MERLIN 6 cm image of the nuclear region of NGC 5506 by Middelberg et al. (2004). Offsets are relative to RA
 , Dec
, Dec . The size of the beam, shown in the bottom-left corner, is 16.5 × 8.0 mas.
Current usage metrics show cumulative count of Article Views (full-text article views including HTML views, PDF and ePub downloads, according to the available data) and Abstracts Views on Vision4Press platform.
Data correspond to usage on the plateform after 2015. The current usage metrics is available 48-96 hours after online publication and is updated daily on week days.
Initial download of the metrics may take a while.