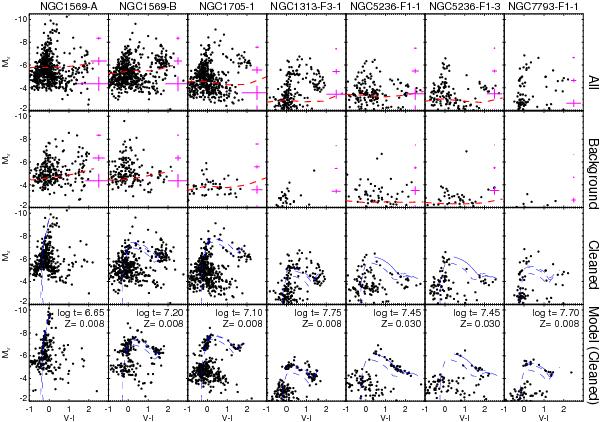
Fig. 2

Top row: observed colour–magnitude diagrams for the seven clusters, showing all stars for which photometry was obtained. The red dashed curves indicate the approximate 50% completeness limits, while error bars show typical photometric errors. Second row from top: Colour–magnitude diagrams for background annuli. Third row: Background-subtracted CMDs (see text for details). Bottom row: simulated CMDs, using Bertelli et al. (2009) isochrones for the ages and metallicities listed in the legends.
Current usage metrics show cumulative count of Article Views (full-text article views including HTML views, PDF and ePub downloads, according to the available data) and Abstracts Views on Vision4Press platform.
Data correspond to usage on the plateform after 2015. The current usage metrics is available 48-96 hours after online publication and is updated daily on week days.
Initial download of the metrics may take a while.


