Fig. 11
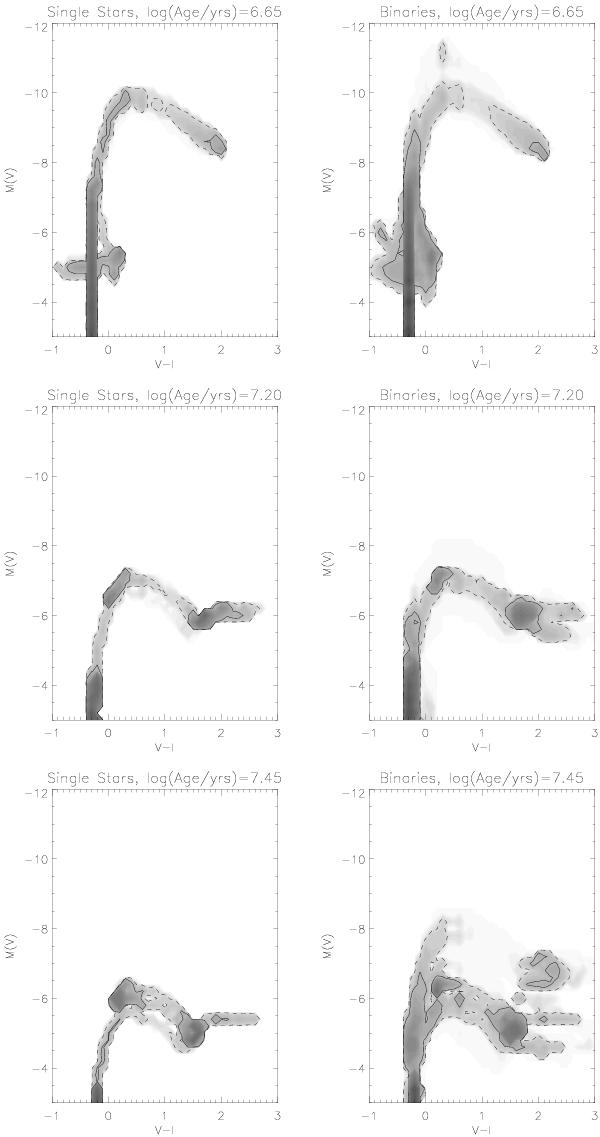
Example CMDs for single stars (left panels) and binary (right panels) populations calculated with BPASS at three ages typical of clusters in our sample. Due to the nature of the binary models the CMDs are created assuming a small age spread for the population of + / − 0.05 dex. The grid cells are 0.1 by 0.2 in V − I and MV respectively. The grey scale is logarithmic in number of stars with the cell size. The dashed and solid contours represent when the density of stars in each cell is 0.1 and 1 respectively.
Current usage metrics show cumulative count of Article Views (full-text article views including HTML views, PDF and ePub downloads, according to the available data) and Abstracts Views on Vision4Press platform.
Data correspond to usage on the plateform after 2015. The current usage metrics is available 48-96 hours after online publication and is updated daily on week days.
Initial download of the metrics may take a while.