Free Access
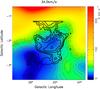
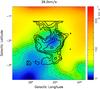
Fig. 8
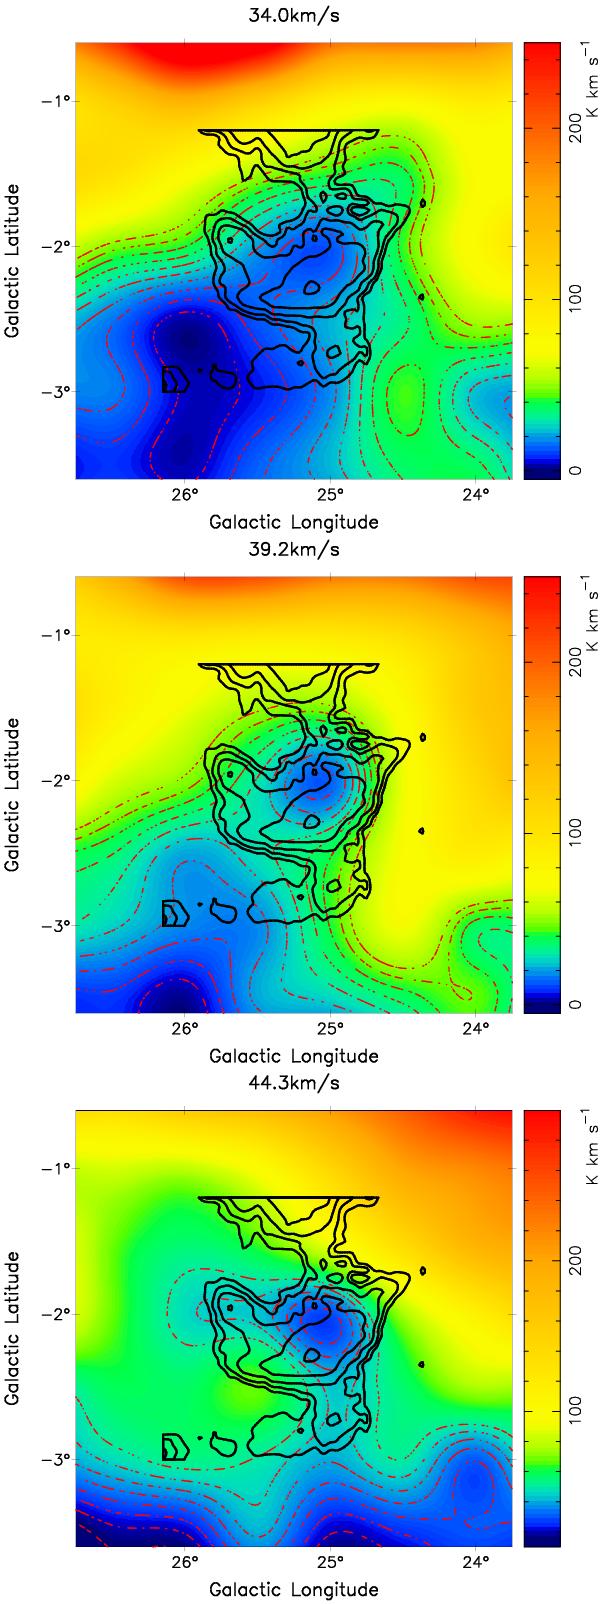
H i survey images with red dash-dot contour lines in the three velocity ranges 32.0–36.1, 37.1–41.2, and 42.2–46.4 km s-1 in the area of G25.1−2.3. The H i cavity seems to have a morphological coincidence with the radio map of G25.1−2.3 (thick black contours).
This figure is made of several images, please see below:
Current usage metrics show cumulative count of Article Views (full-text article views including HTML views, PDF and ePub downloads, according to the available data) and Abstracts Views on Vision4Press platform.
Data correspond to usage on the plateform after 2015. The current usage metrics is available 48-96 hours after online publication and is updated daily on week days.
Initial download of the metrics may take a while.