Free Access
Fig. 6
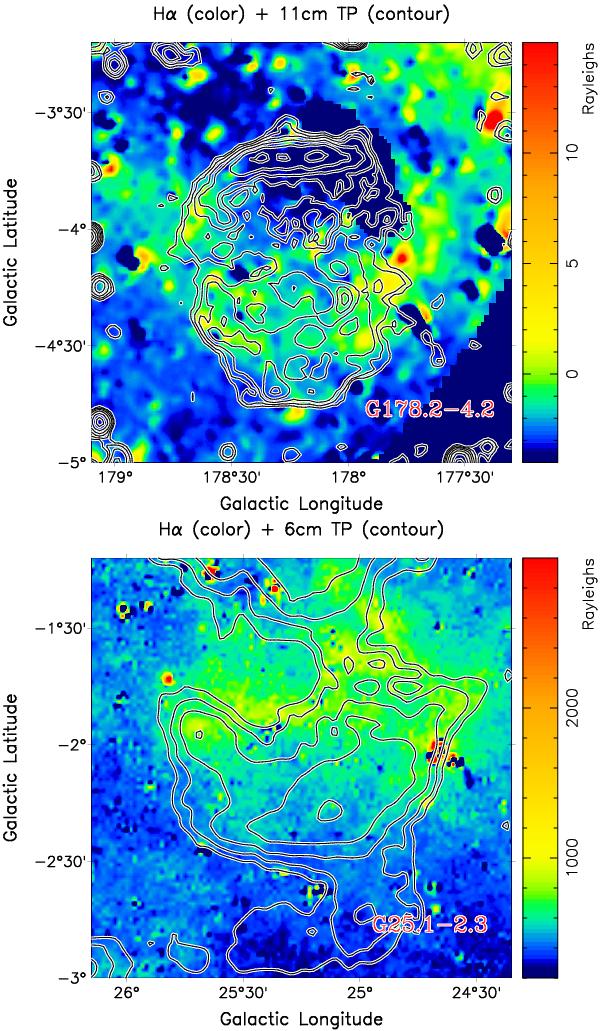
Total-intensity contour maps of G178.2−4.2 at λ11 cm and G25.1−2.3 at λ6 cm with point-like sources subtracted overlaid onto the VTSS Hα image for G178.2−4.2 (upper panel) and the SHASSA Hα image for G25.1−2.3 (lower panel).
This figure is made of several images, please see below:
Current usage metrics show cumulative count of Article Views (full-text article views including HTML views, PDF and ePub downloads, according to the available data) and Abstracts Views on Vision4Press platform.
Data correspond to usage on the plateform after 2015. The current usage metrics is available 48-96 hours after online publication and is updated daily on week days.
Initial download of the metrics may take a while.