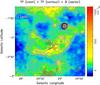
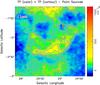
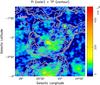
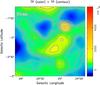
Fig. 2
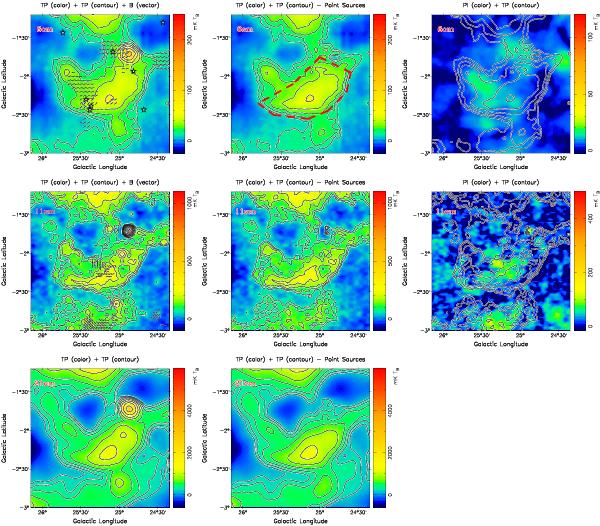
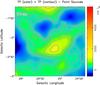
Same as Fig. 1, but for G25.1−2.3. Here the λ11 cm and λ21 cm maps were extracted from the Effelsberg λ11 cm survey (Reich et al. 1990a) and λ21 cm survey (Reich et al. 1990b), respectively. The contours in the λ6 cm total-intensity maps are  (n = 1, 2, 3 ...), in the λ11 cm total-intensity maps are
  (n = 1, 2, 3 ...), and in the λ21 cm total-intensity maps are
  (n = 1, 2, 3 ...). The polarization intensity threshold for the B-vectors is 12.0 mK TB at λ6 cm and 75.0 mK TB at λ11 cm. No polarization data at λ21 cm are presently available. The star-symbols in the λ6 cm maps (top left panel) indicate known pulsars in the field. The polygon in the λ6 cm image in top central panel outlines the area for the TT-plot spectral analysis shown in Fig. 5.
Current usage metrics show cumulative count of Article Views (full-text article views including HTML views, PDF and ePub downloads, according to the available data) and Abstracts Views on Vision4Press platform.
Data correspond to usage on the plateform after 2015. The current usage metrics is available 48-96 hours after online publication and is updated daily on week days.
Initial download of the metrics may take a while.