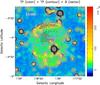
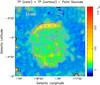
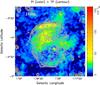
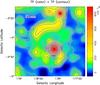
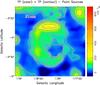
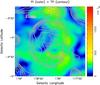
Fig. 1
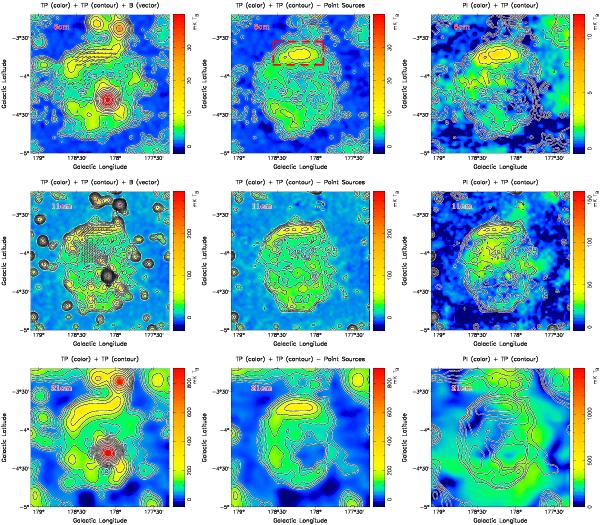
Radio images of G178.2−4.2 at λ6 cm from the Sino-German λ6 cm polarization survey in the top panels, at λ11 cm that we newly observed in the middle panels, and at λ21 cm from the Effelsberg Medium Latitude Survey (EMLS) (Reich et al. 2004) in the bottom panels. The angular resolutions of the λ6 cm, λ11 cm, and λ21 cm maps are 9.5′, 4.4′, and 9.4′, respectively. The left panels show the total-intensity (I) maps in color and in contours, with observed B-vectors overlaid (i.e. the observed E-vectors plus 90°) for polarization intensities PI > 2.4 mK TB at λ6 cm and 32.0 mK TB at λ11 cm. Vectors are not shown at λ21 cm. The vector length is proportional to PI. The I contours in the λ6 cm maps are  , (n = 1, 2, 3 ...), in the λ11 cm maps are
  (n = 1, 2, 3 ...), and in the λ21 cm maps are
  (n = 1, 2, 3 ...). The central panels also display the total-intensity maps, where strong point-like sources have been subtracted, to show the extended emission from the SNR more clearly. The right panels are the polarization intensity images with the contours for the total intensity maps with point-like sources subtracted. The rectangle in the λ6 cm image in the top central panel outlines the area used for the TT-plot spectral analysis displayed in Fig. 5.
Current usage metrics show cumulative count of Article Views (full-text article views including HTML views, PDF and ePub downloads, according to the available data) and Abstracts Views on Vision4Press platform.
Data correspond to usage on the plateform after 2015. The current usage metrics is available 48-96 hours after online publication and is updated daily on week days.
Initial download of the metrics may take a while.