Fig. 9
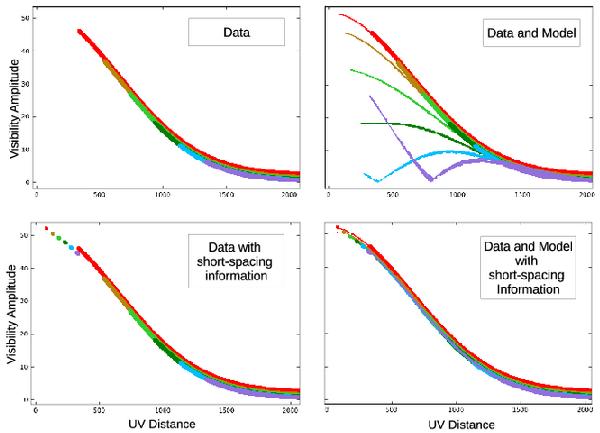
Very large spatial scales – visibility plots: these plots show the observed (left) and reconstructed (right) visibility functions for a simulation in which a large extended flat-spectrum source is observed with an interferometer with a large central hole in its uv-coverage. The colours/shades in these plots represent 6 frequency channels spread between 1 and 4 GHz. The top row of plots shows that when no short-spacing information was used, these data can be mistakenly fit using a less-extended source with a steep spectrum. The bottom row shows that the inclusion of short-spacing information is sufficient to reconstruct the sky brightness distribution correctly.
Current usage metrics show cumulative count of Article Views (full-text article views including HTML views, PDF and ePub downloads, according to the available data) and Abstracts Views on Vision4Press platform.
Data correspond to usage on the plateform after 2015. The current usage metrics is available 48-96 hours after online publication and is updated daily on week days.
Initial download of the metrics may take a while.