Fig. 8
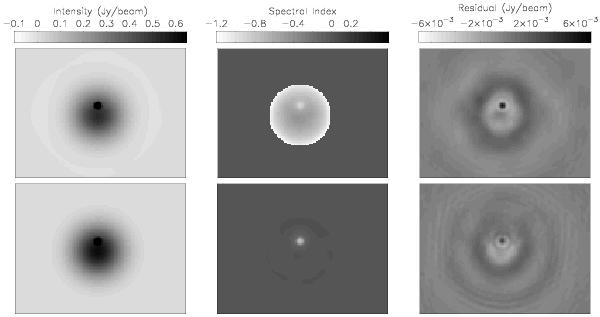
Very large spatial scales – intensity, spectral index, residuals: these images show the intensity distribution (left), spectral index (middle) and the residuals (right) for two imaging runs. The top row shows results without short-spacing information, and shows a false negative α ≈ −0.8 for the extended emission. The bottom row shows results with short-spacing constraints, in which the extended source has been reconstructed correctly.
Current usage metrics show cumulative count of Article Views (full-text article views including HTML views, PDF and ePub downloads, according to the available data) and Abstracts Views on Vision4Press platform.
Data correspond to usage on the plateform after 2015. The current usage metrics is available 48-96 hours after online publication and is updated daily on week days.
Initial download of the metrics may take a while.