Fig. 7
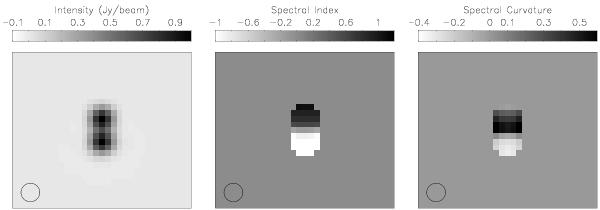
Moderately resolved sources – MSMFS Images: these images show the intensity at 2.5 GHz (left), the spectral index showing a gradient between − 1 and +1 (middle) and the spectral curvature which peaks between the two sources and falls off on either side (right). The angular resolution of these images is 15 arcsec, corresponding to the highest frequency in the data (and Fig. 6).
Current usage metrics show cumulative count of Article Views (full-text article views including HTML views, PDF and ePub downloads, according to the available data) and Abstracts Views on Vision4Press platform.
Data correspond to usage on the plateform after 2015. The current usage metrics is available 48-96 hours after online publication and is updated daily on week days.
Initial download of the metrics may take a while.