Fig. 4
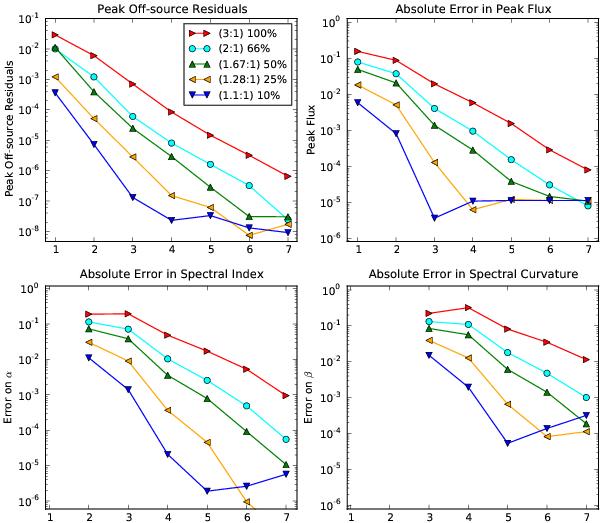
Peak residuals and Errors for MFS with different values of Nt: These plots show the measured peak residuals (top left) and the errors on Iυ0 (top right), Iα (bottom left), and Iβ (bottom right) when a point-source of flux 1.0 Jy and α = −1.0 was imaged using Taylor polynomials of different orders (Nt = 1−7) and a linear spectral basis. The x-axis of all these plots show the value of Nt used for the simulation and plots for α and β begin from Nt = 2 and Nt = 3 respectively. An example of how to read these plots: for a 2:1 bandwidth ratio, a source with spectral index = –1.0 and Nt = 4, the achievable dynamic range (measured as the ratio of the peak flux to the peak residual near the source) is about 105, the error on the peak flux at the reference frequency is 1 part in 103, and the absolute errors on α anre β are 10-2 and 10-1 respectively.
Current usage metrics show cumulative count of Article Views (full-text article views including HTML views, PDF and ePub downloads, according to the available data) and Abstracts Views on Vision4Press platform.
Data correspond to usage on the plateform after 2015. The current usage metrics is available 48-96 hours after online publication and is updated daily on week days.
Initial download of the metrics may take a while.