Fig. 3
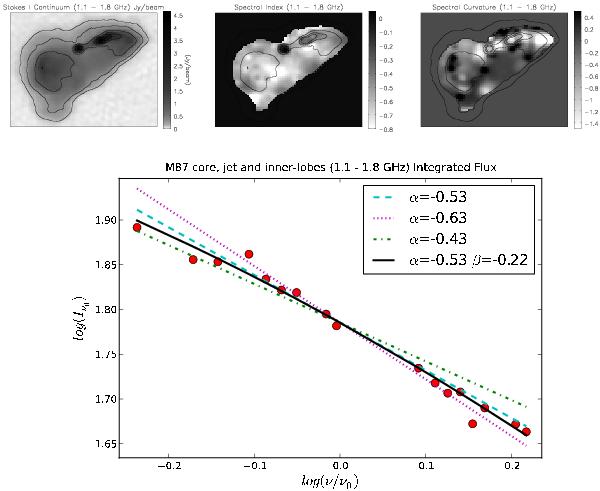
M 87 core/jet/lobe – intensity, spectral index and curvature: these images show 3-arcsec resolution maps of the central bright region of M 87 (core+jet and inner lobes). The quantities displayed are the intensity at 1.5 GHz (top left), the spectral index (top middle) and the spectral curvature (top right). The spectral index is near zero at the core, varies between − 0.36 and − 0.6 along the jet and out into the lobes. The spectral curvature is on average 0.5 which translates to △ α = 0.2 across L-band. The plot at the bottom compares the resulting average spectrum (solid line) with that formed by imaging each spectral-window separately (dots). The dashed and dotted lines correspond to fixed values of spectral index (–0.43, –0.53, –0.63).
Current usage metrics show cumulative count of Article Views (full-text article views including HTML views, PDF and ePub downloads, according to the available data) and Abstracts Views on Vision4Press platform.
Data correspond to usage on the plateform after 2015. The current usage metrics is available 48-96 hours after online publication and is updated daily on week days.
Initial download of the metrics may take a while.