Fig. 2
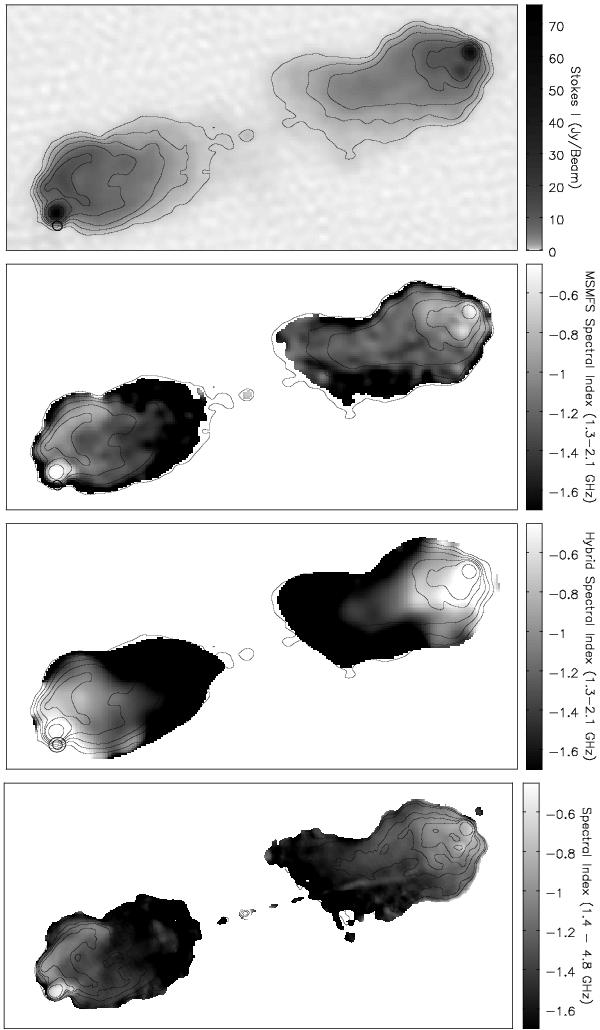
Cygnus A – total intensity and spectral-index: this figure shows the MS-MFS total intensity map (top), and spectral-index maps obtained via three methods – MS-MFS (second row), a hybrid single-band method (third row), and from high-resolution full-synthesis narrow-band images at 1.4 and 4.8 GHz (bottom). The MS-MFS spectral index map has the angular-resolution of the total intensity map, and agrees with the values in the high-resolution comparison map (α = −0.5 at the hotspots increasing to α ≈ − 1.0 in the halo). However, the hybrid method resulted in a map with a wider range of values (positive and negative) and is at a much lower angular resolution.
Current usage metrics show cumulative count of Article Views (full-text article views including HTML views, PDF and ePub downloads, according to the available data) and Abstracts Views on Vision4Press platform.
Data correspond to usage on the plateform after 2015. The current usage metrics is available 48-96 hours after online publication and is updated daily on week days.
Initial download of the metrics may take a while.