Fig. 11
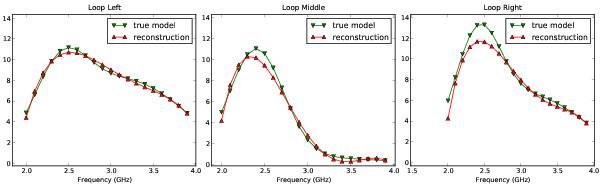
Band-limited signals – spectra across the source: these plots show the true (down-arrows) and reconstructed (up-arrows) spectra at different locations for the example discussed in this section (shown in Fig. 10). The left column corresponds to the left end of the loop at the location of the leg and shows smooth structure stretching almost all across the band. The middle column corresponds to the middle of the source where the only structure in the line-of-sight is the upper part of the loop (emission at a small fraction of the band). The right column shows spectra for the brightest point on the right end of the loop.
Current usage metrics show cumulative count of Article Views (full-text article views including HTML views, PDF and ePub downloads, according to the available data) and Abstracts Views on Vision4Press platform.
Data correspond to usage on the plateform after 2015. The current usage metrics is available 48-96 hours after online publication and is updated daily on week days.
Initial download of the metrics may take a while.