Fig. 1
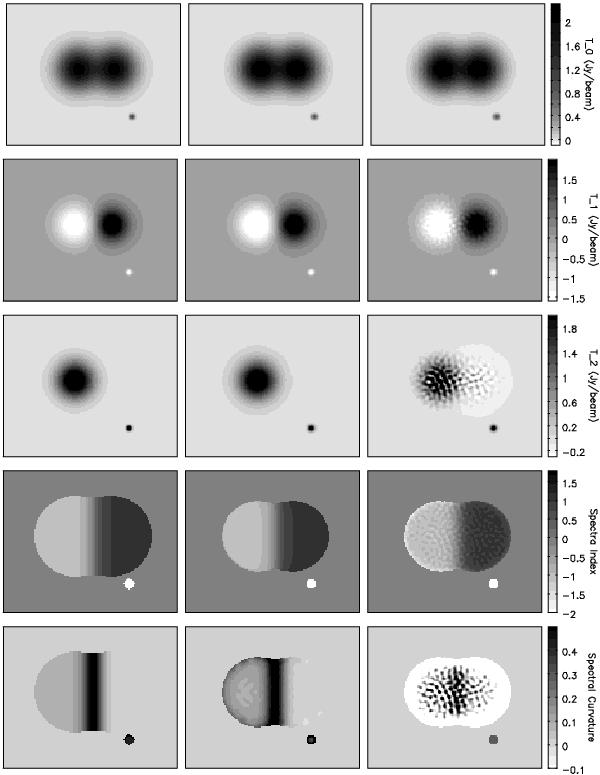
MS-MFS imaging results using simulated EVLA data: these images compare truth images (left column) with the results of two wide-band imaging runs; multi-scale (middle column) and point-source (right column). The top three rows represent the first three Taylor-coefficient images, and the fourth and fifth rows show spectral index and spectral curvature respectively.
Current usage metrics show cumulative count of Article Views (full-text article views including HTML views, PDF and ePub downloads, according to the available data) and Abstracts Views on Vision4Press platform.
Data correspond to usage on the plateform after 2015. The current usage metrics is available 48-96 hours after online publication and is updated daily on week days.
Initial download of the metrics may take a while.