Fig. 6
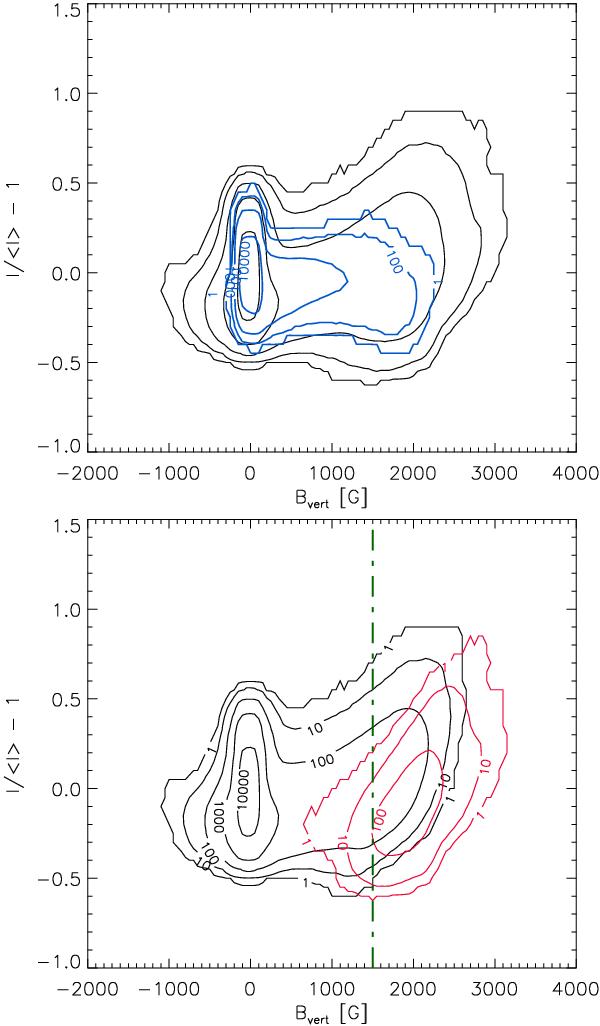
Upper panel: contour plot of the 2D histogram of the number of pixels at original resolution, binned and smoothed (black lines). The contours and labels for the original distribution are the same as in Fig. 2. Overlaid are the contours for the case after convolution and rebinning, corresponding to 0.5 m aperture, also binned and smoothed (blue contours). Lower panel: contour plot of the 2D histogram of the number of pixels at original resolution, with pixels divided into two groups (red & black contours): pixels with Bvert > 1500 G after convolution to 0.5 m telescope aperture are shown with red contours. These correspond to the pixels outlined in red in the middle panel of Fig. 5. The remaining pixels correspond to the black contours. The vertical dash-dotted line indicates the field strength of 1500 G chosen for the separation.
Current usage metrics show cumulative count of Article Views (full-text article views including HTML views, PDF and ePub downloads, according to the available data) and Abstracts Views on Vision4Press platform.
Data correspond to usage on the plateform after 2015. The current usage metrics is available 48-96 hours after online publication and is updated daily on week days.
Initial download of the metrics may take a while.