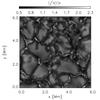
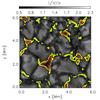
Fig. 5
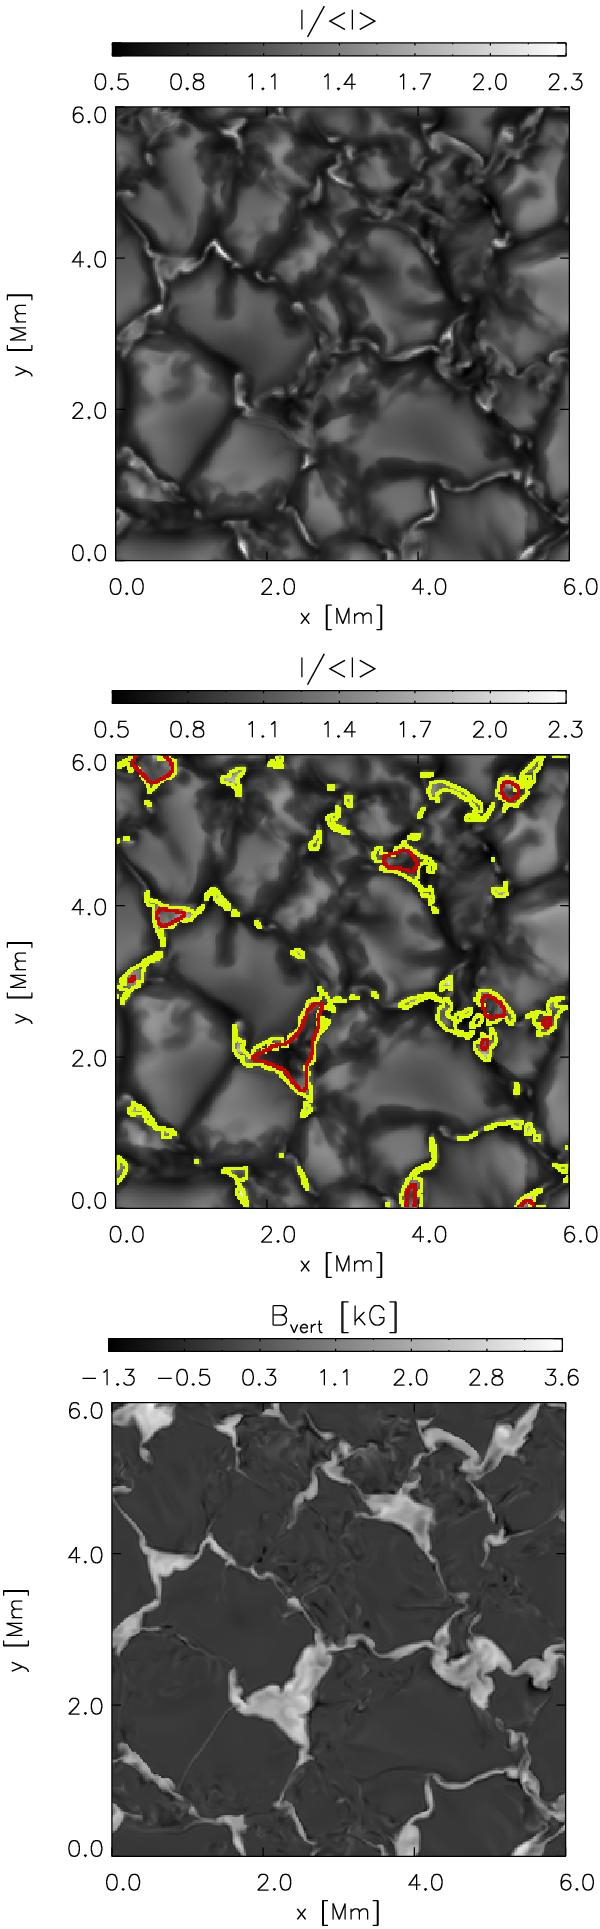
Normalized continuum intensity (upper panel) and the corresponding vertical magnetic field (lower panel) at original resolution. The middle panel shows the same intensity image as the top panel, but with regions of Bvert > 1500 G outlined in yellow for original resolution and outlined in red for the resolution corresponding to 0.5 m telescope aperture.
Current usage metrics show cumulative count of Article Views (full-text article views including HTML views, PDF and ePub downloads, according to the available data) and Abstracts Views on Vision4Press platform.
Data correspond to usage on the plateform after 2015. The current usage metrics is available 48-96 hours after online publication and is updated daily on week days.
Initial download of the metrics may take a while.