Free Access
Fig. 5
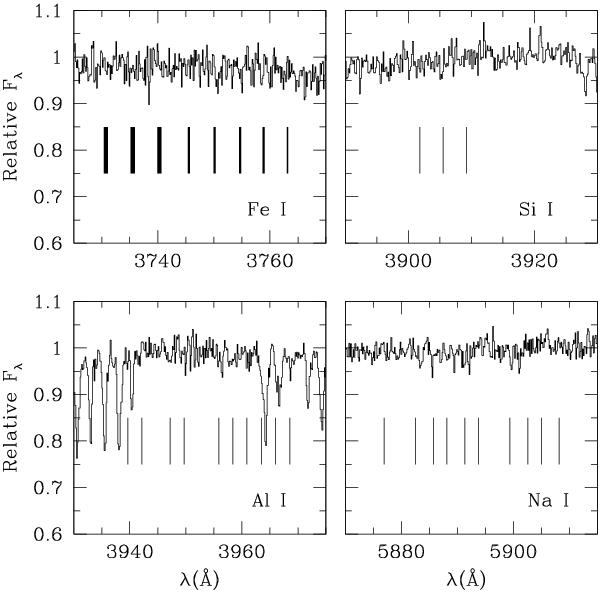
Spectra in the vicinity of the strongest Fe I (3734.8638, 3749.4851, and 3758.2330 Å), Si I (3905.523 Å), Al I (3944.0060 and 3961.5200 Å), and Na I (5889.951 and 5895.924 Å) lines compared to the predicted Zeeman-split line positions assuming a magnetic field of 0.519 MG.
Current usage metrics show cumulative count of Article Views (full-text article views including HTML views, PDF and ePub downloads, according to the available data) and Abstracts Views on Vision4Press platform.
Data correspond to usage on the plateform after 2015. The current usage metrics is available 48-96 hours after online publication and is updated daily on week days.
Initial download of the metrics may take a while.