Fig. 3
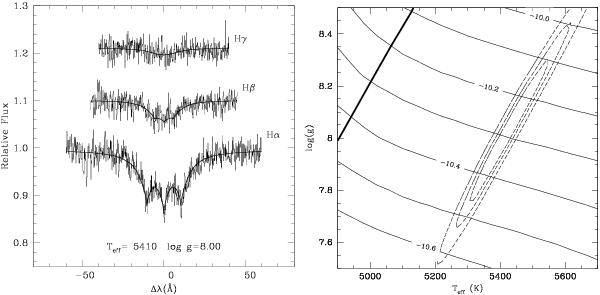
Balmer lines (Hα to Hγ) and best-fitting model (Teff = 5410 K, log g = 8.0) showing prominent Zeeman-split Hα line (left panel), and (right panel) χ2 contours at 66, 90, and 99% confidence (dashed lines) in the (Teff, log g) plane. The measured calcium abundance from Ca II lines (log n(Ca)/n(H)) is drawn (full lines) as a function of the assumed temperature and surface gravity and labelled with the logarithm of the abundance. The thick line shows the range of temperature and surface gravity where the abundance measurements based on Ca I or Ca II are consistent.
Current usage metrics show cumulative count of Article Views (full-text article views including HTML views, PDF and ePub downloads, according to the available data) and Abstracts Views on Vision4Press platform.
Data correspond to usage on the plateform after 2015. The current usage metrics is available 48-96 hours after online publication and is updated daily on week days.
Initial download of the metrics may take a while.