Fig. 7
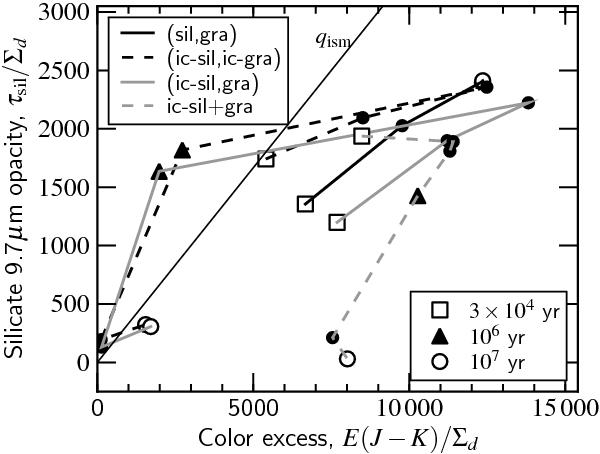
The opacity in the 9.7 μm silicate feature vs. near-IR color excess for the four aggregate models presented in Fig. 6. Each model is identified by a color/line style as indicated in the legend. The initial (t = 0.03 Myr) value of τsil and E(J − K) per unit column density is indicated by an empty square, the final value (t = 10 Myr) by an empty circle, and intermediate times are indicated by black dots.
Current usage metrics show cumulative count of Article Views (full-text article views including HTML views, PDF and ePub downloads, according to the available data) and Abstracts Views on Vision4Press platform.
Data correspond to usage on the plateform after 2015. The current usage metrics is available 48-96 hours after online publication and is updated daily on week days.
Initial download of the metrics may take a while.