Fig. 2
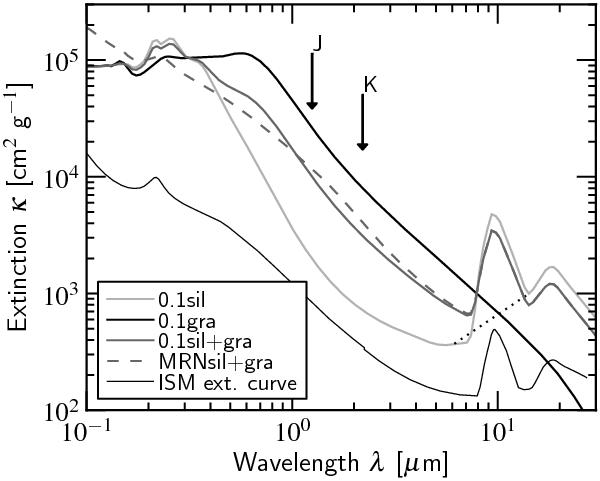
The near/mid-IR extinction for spherical grains. The curves show the opacities corresponding to 0.1 μm spheres of silicate (light gray) and graphite (black). Dark gray curves correspond to a 1:2 mix of graphite to silicates of 0.1 μm grains (solid gray curve) and for the MRN distribution (dashed curve). The dotted curve shows the adopted continuum for calculating κsil, the amount of extinction in the 9.7 μm silicate feature. Shown for illustrative purposes is the observed ISM extinction curve (thin solid curve) with arbitrary scaling in the y-direction.
Current usage metrics show cumulative count of Article Views (full-text article views including HTML views, PDF and ePub downloads, according to the available data) and Abstracts Views on Vision4Press platform.
Data correspond to usage on the plateform after 2015. The current usage metrics is available 48-96 hours after online publication and is updated daily on week days.
Initial download of the metrics may take a while.