Fig. 5
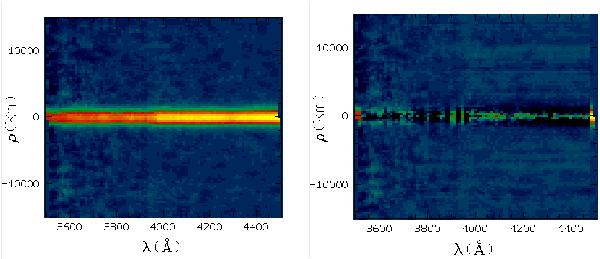
Combined spectrum of 133P in the region of the CN band (left) and that of the “gas” (right), after the subtraction of the dust spectrum. The intensity scale is the same for both and the look up table is logarithmic. The spectral region is between 3500 and 4500 Å and the spatial region is from − 15 000 to 15 000 km of projected nucleocentric distance (ρ). Notice that no emission bands are seen within the SNR. The region very close to the object photometric center is very noisy because the emission of the dust is strong, but a few thousands km farther the SNR improves.
Current usage metrics show cumulative count of Article Views (full-text article views including HTML views, PDF and ePub downloads, according to the available data) and Abstracts Views on Vision4Press platform.
Data correspond to usage on the plateform after 2015. The current usage metrics is available 48-96 hours after online publication and is updated daily on week days.
Initial download of the metrics may take a while.