Fig. 1
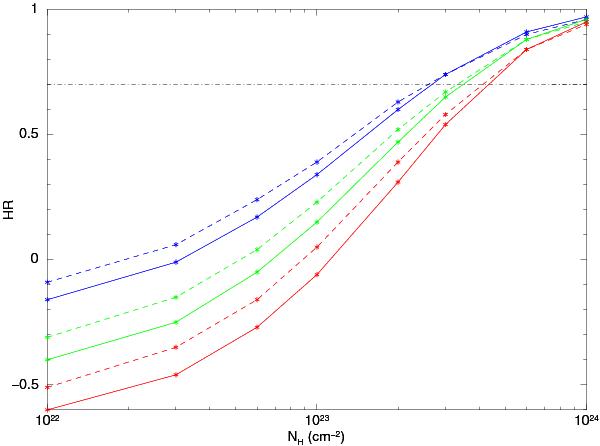
Expected hardness ratio (of the count rates in the energy ranges 1–3 to 3–10 keV) as a function of the column density. Solid and dashed lines refer to the pn and the MOS cameras, respectively. Red, green, and blue lines refer to power-law spectra with photon indices of 2, 1.5, and 1, respectively. The horizontal line at HR = 0.7 represents the threshold value used to select highly absorbed sources.
Current usage metrics show cumulative count of Article Views (full-text article views including HTML views, PDF and ePub downloads, according to the available data) and Abstracts Views on Vision4Press platform.
Data correspond to usage on the plateform after 2015. The current usage metrics is available 48-96 hours after online publication and is updated daily on week days.
Initial download of the metrics may take a while.