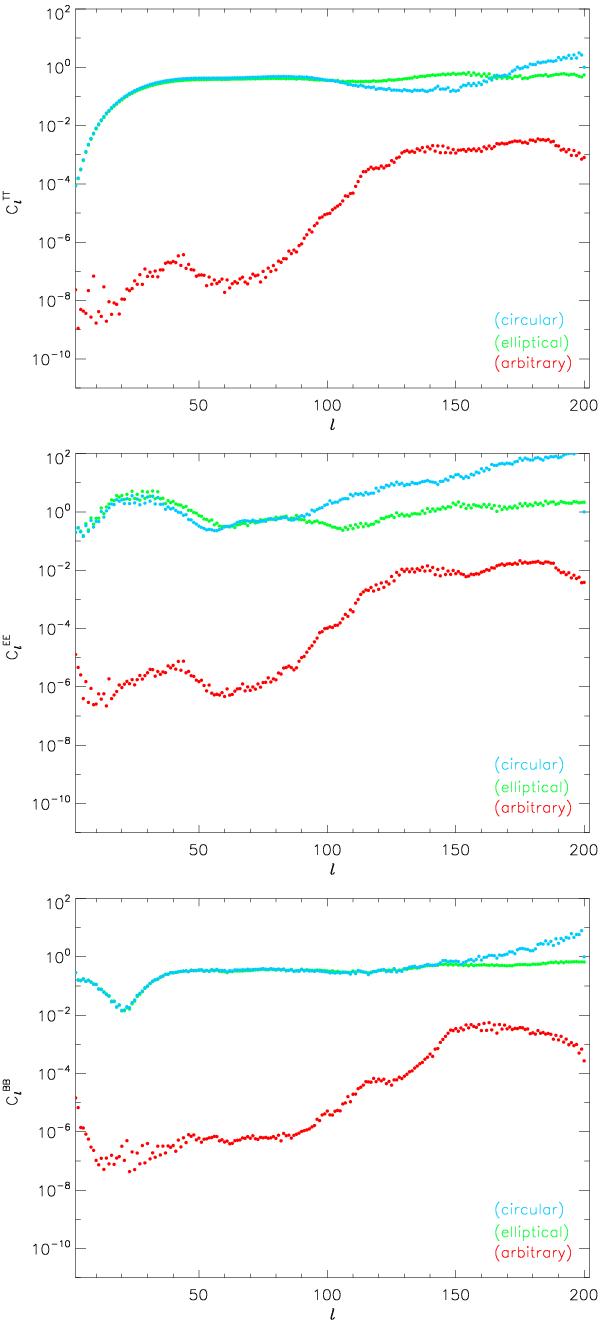
Fig. 6

Power spectra of the residuals in T (top), E, (middle) and B (bottom) divided by the power spectrum of the input sky. Shown here are the results of the analysis of the complex-beam simulation, by the three different beams. The red, green and blue points show these different analyses using the true, elliptical and circular beams, respectively. As the true beam, including its side-lobes, spans some 15° all scales are effected by the beam; as seen in the figures in the large difference between the fractional errors of the analysis performed using the true beam and the analyses using the elliptical and circular beams. The fractional errors of the analyses using the elliptical and circular beams, are seen to diverge from the scale at which the difference between these two beams becomes important.
Current usage metrics show cumulative count of Article Views (full-text article views including HTML views, PDF and ePub downloads, according to the available data) and Abstracts Views on Vision4Press platform.
Data correspond to usage on the plateform after 2015. The current usage metrics is available 48-96 hours after online publication and is updated daily on week days.
Initial download of the metrics may take a while.


