Fig. 3
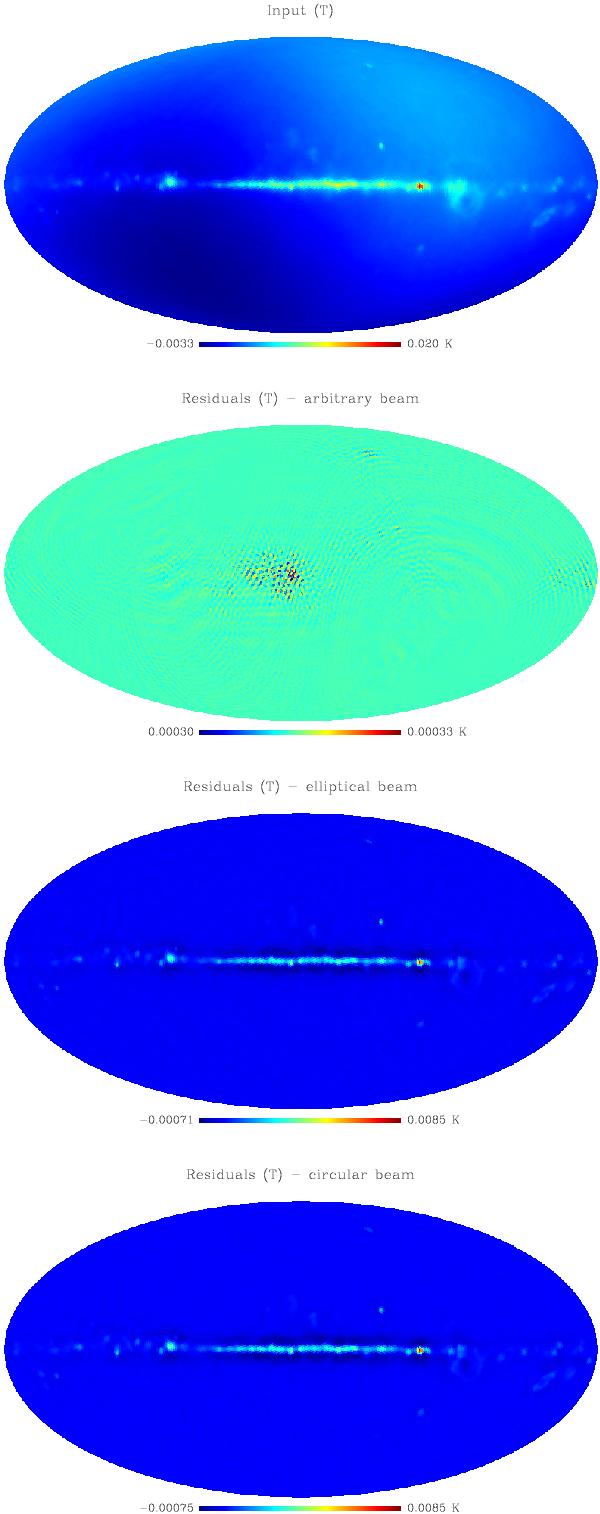
Top panel shows the input temperature multipoles,  synthesised onto a HEALPix map of Nside = 64. The lower panels show the residuals between the input and the recovered temperature multipoles, in the cases of the three different beams, from top to bottom the residuals maps are from the analysis with the true, elliptical and circular beams. Note that each residual map has a different colour scale.
Current usage metrics show cumulative count of Article Views (full-text article views including HTML views, PDF and ePub downloads, according to the available data) and Abstracts Views on Vision4Press platform.
Data correspond to usage on the plateform after 2015. The current usage metrics is available 48-96 hours after online publication and is updated daily on week days.
Initial download of the metrics may take a while.