Fig. A.1
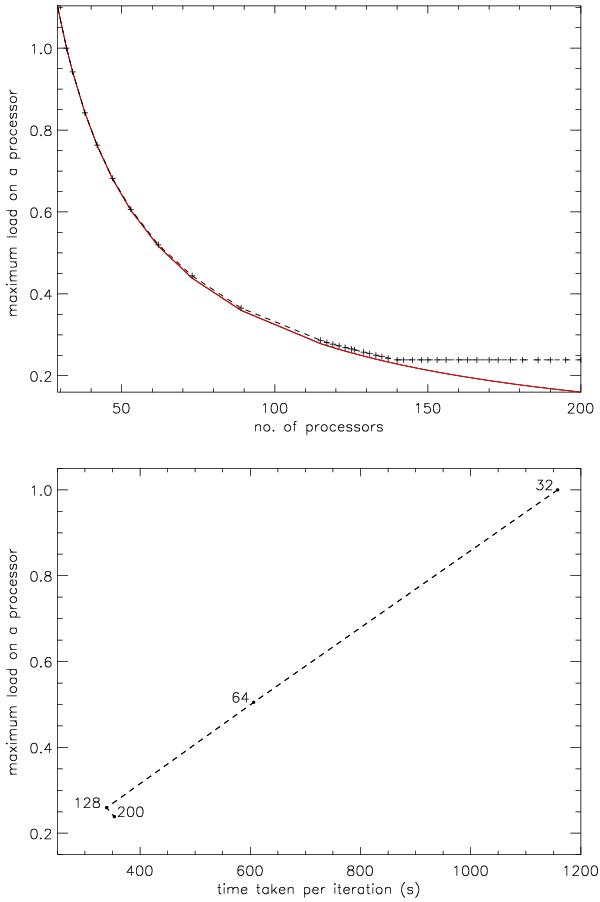
Scaling of the map-making algorithm with the number of processors used. Since each processor is assigned a number of different values of ℓ, the number of processors to which the code will successfully scale will depend on the value of ℓmax to which the analysis is to be performed. For a given ℓmax there will be a number of processors above which it is not possible to balance the load between them. This is shown in the top plot for ℓmax = 400. The black crosses show the load on the processor with the heaviest workload, normalised by the equivalent value for 32 processors. The red curve shows the reduction in the workload assuming perfect load balancing. It is seen that there is no reduction in the maximum load once the number of processors is increased beyond 142. The bottom plot shows the relationship between the maximum load and the time required per iteration of the code, where the dashed line shows the expected relationship and the black points, labeled with the number of processor used, show the observed behaviour.
Current usage metrics show cumulative count of Article Views (full-text article views including HTML views, PDF and ePub downloads, according to the available data) and Abstracts Views on Vision4Press platform.
Data correspond to usage on the plateform after 2015. The current usage metrics is available 48-96 hours after online publication and is updated daily on week days.
Initial download of the metrics may take a while.