Fig. 14
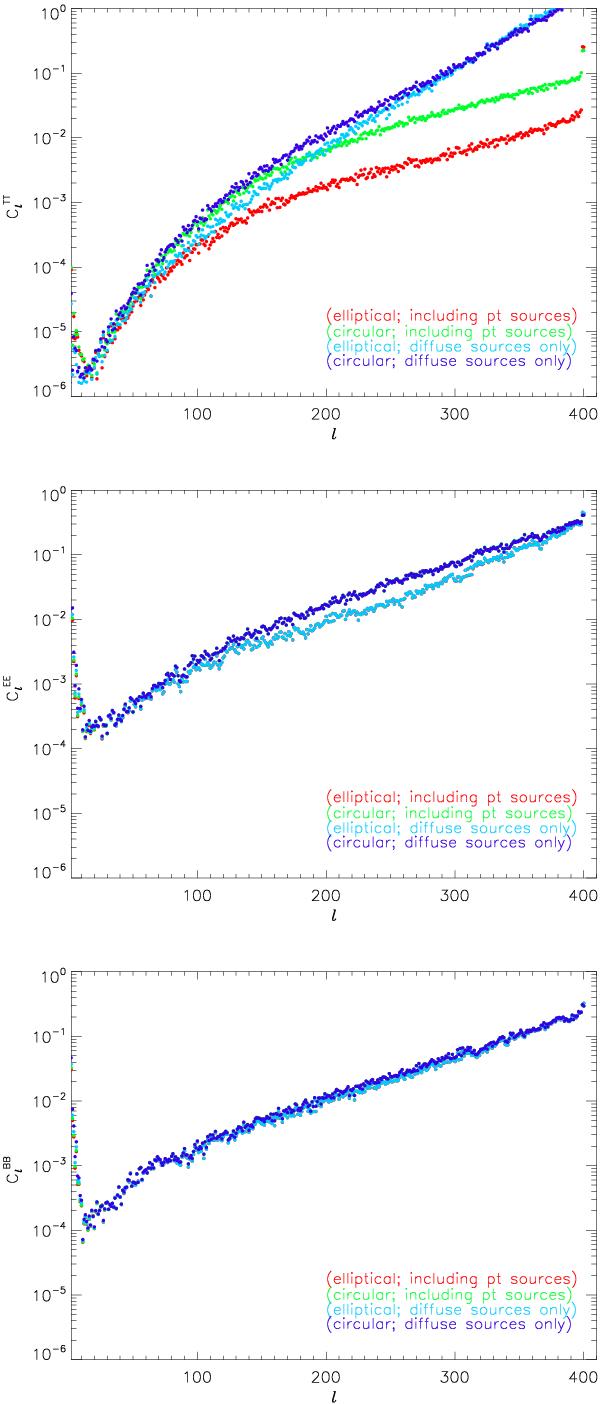
Power spectra of the residuals in T (top), E, (middle) and B (bottom) divided by the power spectrum of the input sky. Shown here are the results of the analysis of two different sets of simulated data with two different beams. Both data set were simulated using the elliptical beams, and contain the CMB, diffuse Galactic foregrounds and 1/f and white noise. The second simulated data set additionally includes point and SZ sources. Each data set was analysed twice, once using the elliptical beams and once with the circular beams. The dark and light blue points are from the analysis of the first data set, with the circular and elliptical beams respectively. The green and red points correspond to the analysis of the second data set again with the circular and elliptical beams respectively. The differences between the recoveries due to the beams may easily be seen in the figures. In the temperature power spectra the differences are only apparent at intermediate ℓ-values, for the case where there are no point sources, as at higher ℓ-values the noise dominates. The up-turn in the fractional residuals in all the figures at low ℓ is due to residual 1/f noise, that was not removed by discarding the zero-frequency Fourier coefficients from the analysis.
Current usage metrics show cumulative count of Article Views (full-text article views including HTML views, PDF and ePub downloads, according to the available data) and Abstracts Views on Vision4Press platform.
Data correspond to usage on the plateform after 2015. The current usage metrics is available 48-96 hours after online publication and is updated daily on week days.
Initial download of the metrics may take a while.