Fig. 10
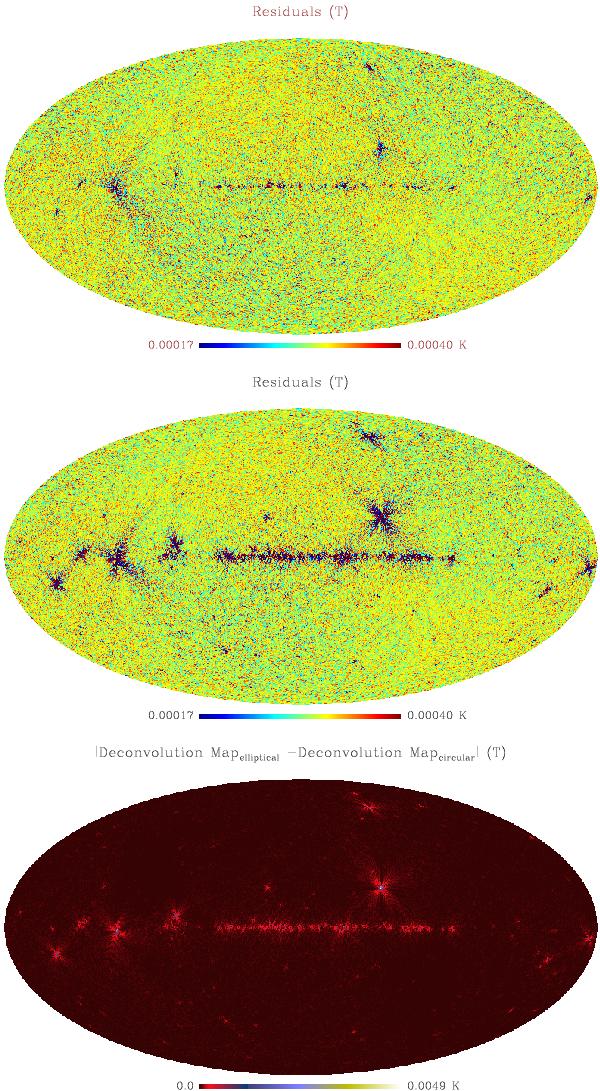
Top: residuals between the input-sky, including SZ and point sources, and the recovered map, plotted over the same range as the residuals found when SZ and point sources were not included in the input-sky. Middle: residuals between the input-sky, including SZ and point sources, and the map recovered using the circular beams, plotted over the same range as the top panel. Bottom: absolute differences between the maps recovered using the elliptical and circular beams, in the case when SZ and point sources are included.
Current usage metrics show cumulative count of Article Views (full-text article views including HTML views, PDF and ePub downloads, according to the available data) and Abstracts Views on Vision4Press platform.
Data correspond to usage on the plateform after 2015. The current usage metrics is available 48-96 hours after online publication and is updated daily on week days.
Initial download of the metrics may take a while.