Free Access
Fig. 3
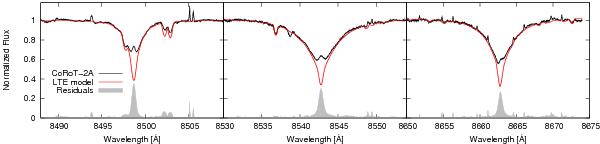
Ca ii infrared triplet in the spectrum of CoRoT-2a (black), which is used as activity diagnostic. The activity indicators are calculated relative to an LTE synthetic spectrum (red) based on the residuals (gray) as outlined in Busà et al. (2007). The small emission features result from sky emission (cf., Sect. 2.1).
Current usage metrics show cumulative count of Article Views (full-text article views including HTML views, PDF and ePub downloads, according to the available data) and Abstracts Views on Vision4Press platform.
Data correspond to usage on the plateform after 2015. The current usage metrics is available 48-96 hours after online publication and is updated daily on week days.
Initial download of the metrics may take a while.