Fig. 3
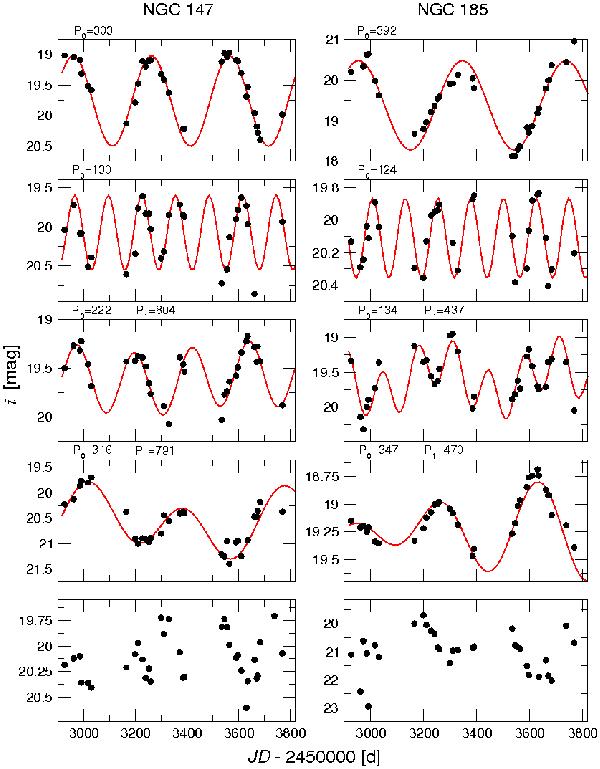
Example light curves of detected LPVs in each of the target galaxies (NGC 147 on the left and NGC 185 on the right side). The black dots illustrate the observational data, while the red lines display the fitted light curve derived with SIGSPEC (Reegen 2007). Shown are different types of LPVs (mono-periodic variations, two periods, and LPVs with no significant period).
Current usage metrics show cumulative count of Article Views (full-text article views including HTML views, PDF and ePub downloads, according to the available data) and Abstracts Views on Vision4Press platform.
Data correspond to usage on the plateform after 2015. The current usage metrics is available 48-96 hours after online publication and is updated daily on week days.
Initial download of the metrics may take a while.