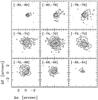
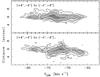
Fig. 13

Maps from the Very Large Array in the SiO (v = 0,J = 1−0) line for X Her. The upper panels show 2 km s-1 wide channel maps, and the lower panels show position (in arcsecs, along the vertical axis) – velocity (in km s-1, along the horizontal axis) diagrams along the NE–SW [labelled (+4, +4) to (–4, –4)] and NW–SE [labelled (+4, –4) to (–4, +4)] directions. Velocities are with respect to the local standard of rest (systemic velocity of X Her is –72.5 km s-1). The lower panels show evidence of a bipolar outflow in the NE–SW direction (thus perpendicular to the space motion) and of a rotating disk in the NW–SE direction. The contour increments are 10 mJy km s-1 per beam for the channel maps in the upper panel and 5 mJy per beam for the position-velocity diagrams in the lower panel. The beam size is 0.45″ × 0.40″ (with a position angle of − 88deg).
Current usage metrics show cumulative count of Article Views (full-text article views including HTML views, PDF and ePub downloads, according to the available data) and Abstracts Views on Vision4Press platform.
Data correspond to usage on the plateform after 2015. The current usage metrics is available 48-96 hours after online publication and is updated daily on week days.
Initial download of the metrics may take a while.