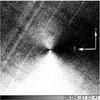
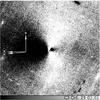
Fig. 8

Enhanced gas images of the comet obtained on October 27 and 29, 2010. The Larson-Sekanina method has been applied to fully calibrated images after subtracting the underlying continuum as explained in Sect. 2. From left to right: CN on October 27 at 02:45 UT (mid-time during exposure), CN on October 29 at 05:15 UT (mid-time during exposure), C3 on October 29 at 03:02 UT (mid-time during exposure). The FOV is 11 800 × 11 800 km. Aside from the reported CN jet by Samarasinha et al. (2011) and Meech et al. (2011), the C3 coma distribution also displays similar jet structures in the north-south direction.

Current usage metrics show cumulative count of Article Views (full-text article views including HTML views, PDF and ePub downloads, according to the available data) and Abstracts Views on Vision4Press platform.
Data correspond to usage on the plateform after 2015. The current usage metrics is available 48-96 hours after online publication and is updated daily on week days.
Initial download of the metrics may take a while.