Free Access
Fig. 1
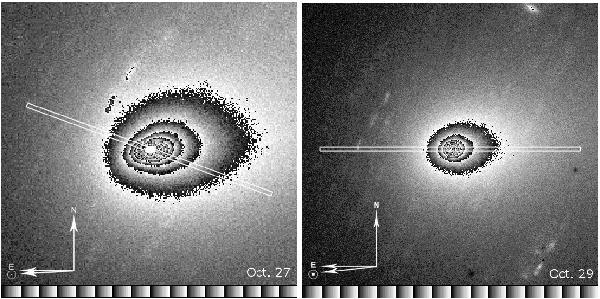
Images of 103P/Hartley 2 on October 27 and 29, 2010 on which we have superimposed an imaginary slit to show the directions for which dust and gas radial profiles are obtained during the spectroscopic observations.
This figure is made of several images, please see below:
Current usage metrics show cumulative count of Article Views (full-text article views including HTML views, PDF and ePub downloads, according to the available data) and Abstracts Views on Vision4Press platform.
Data correspond to usage on the plateform after 2015. The current usage metrics is available 48-96 hours after online publication and is updated daily on week days.
Initial download of the metrics may take a while.