Fig. 4
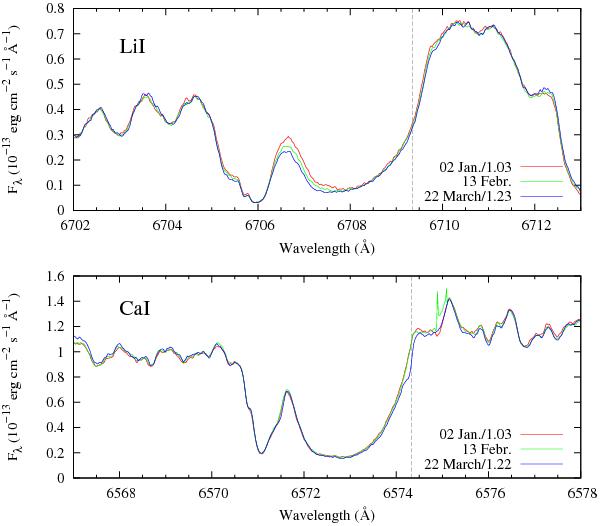
Spectral variability in the profiles of the LiI λ 6707 and CaI λ 6572 lines as seen in our three UVES spectra from 2009. The January and March spectrum were rescaled to fit the local pseudo-continuum in February. The feature at around 6575 Å in the February spectrum caused by a cosmic-ray hit. The vertical dashed line marks the object heliocentric velocity of 71 km s-1.
Current usage metrics show cumulative count of Article Views (full-text article views including HTML views, PDF and ePub downloads, according to the available data) and Abstracts Views on Vision4Press platform.
Data correspond to usage on the plateform after 2015. The current usage metrics is available 48-96 hours after online publication and is updated daily on week days.
Initial download of the metrics may take a while.