Free Access
Fig. 6

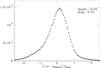
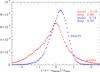
Comparison of our results with those of Zwitter et al. (2010). Top panel: all 215 167 stars with two distances; lower panel: stars with log g ≥ 3.5 or < 3.5 grouped separately. The statistical uncertainties can be seen to be smaller than some of the points.
This figure is made of several images, please see below:
Current usage metrics show cumulative count of Article Views (full-text article views including HTML views, PDF and ePub downloads, according to the available data) and Abstracts Views on Vision4Press platform.
Data correspond to usage on the plateform after 2015. The current usage metrics is available 48-96 hours after online publication and is updated daily on week days.
Initial download of the metrics may take a while.