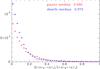
Fig. 4

Top: distribution of fractional differences in distances from repeat observations. Bottom: distribution of distance differences divided by the quadrature-sum of the formal errors of each distance. As in Fig. 1, the quantity plotted vertically is the number of stars in each bin divided by the bin’s width, and the vertical bars show the statistical uncertainty.
Current usage metrics show cumulative count of Article Views (full-text article views including HTML views, PDF and ePub downloads, according to the available data) and Abstracts Views on Vision4Press platform.
Data correspond to usage on the plateform after 2015. The current usage metrics is available 48-96 hours after online publication and is updated daily on week days.
Initial download of the metrics may take a while.