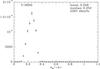
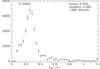
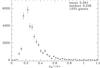
Fig. 1
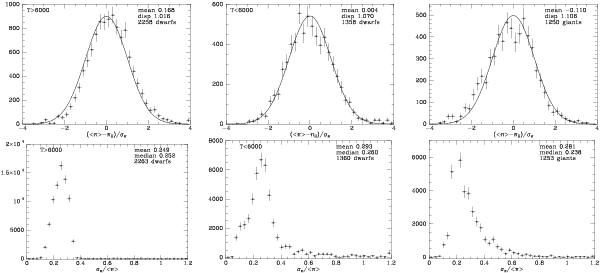
Upper panels: distribution of normalized residuals (16) between our spectrophotometric parallaxes and values from Hipparcos. In this and subsequent histograms the quantity plotted vertically is the number of objects in the bin divided by the bin’s width, and an error bar shows the statistical uncertainty of each point. The mean and dispersion of each distribution are given at top right. A Gaussian of zero mean and unit dispersion is over-plotted. Lower panels: the distribution of fractional uncertainties in the spectrophotometric parallaxes. For the top panel the errors are found by adding our uncertainty and that of Hipparcos in quadrature; for the bottom panel the errors are just the spectrophotometric ones.
Current usage metrics show cumulative count of Article Views (full-text article views including HTML views, PDF and ePub downloads, according to the available data) and Abstracts Views on Vision4Press platform.
Data correspond to usage on the plateform after 2015. The current usage metrics is available 48-96 hours after online publication and is updated daily on week days.
Initial download of the metrics may take a while.