Fig. 9
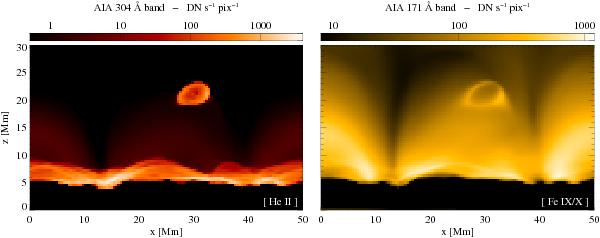
Synthesized images as they would be observed at the limb by AIA/SDO in the 304 Å and 171 Å bands dominated by the He ii line and the Fe ix/x lines, respectively. These snapshots shows the ejection at t = 47 min, i.e., at the same time as the middle row of Fig. 1 and as Fig. A.1. The original synthesized images are downgraded to match the spatial resolution of AIA/SDO. The intensity is given in expected AIA counts per pixel and second.
Current usage metrics show cumulative count of Article Views (full-text article views including HTML views, PDF and ePub downloads, according to the available data) and Abstracts Views on Vision4Press platform.
Data correspond to usage on the plateform after 2015. The current usage metrics is available 48-96 hours after online publication and is updated daily on week days.
Initial download of the metrics may take a while.