Fig. 8
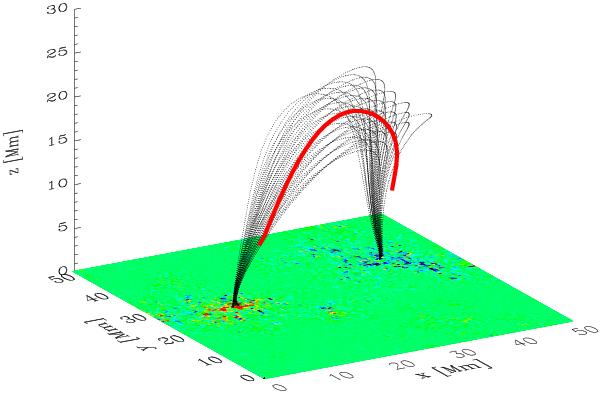
Magnetic field configuration at timestep t = 15 min (well before the plasma ejection lifts off) together with trajectory of the plasma ejection (center-of-gravity) overplotted as a red line. The map at the bottom shows the vertical magnetic field at the bottom boundary of the simulation box scaled from −2000 G (blue) to +2000 G (red).
Current usage metrics show cumulative count of Article Views (full-text article views including HTML views, PDF and ePub downloads, according to the available data) and Abstracts Views on Vision4Press platform.
Data correspond to usage on the plateform after 2015. The current usage metrics is available 48-96 hours after online publication and is updated daily on week days.
Initial download of the metrics may take a while.