Fig. 3
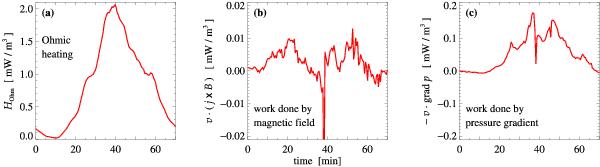
Temporal evolution of plasma properties in the source region of the plasma ejection. The panels show a) the Ohmic heating rate HOhm = μ0ηj2; b) the work done by the magnetic field and c) the work done by the pressure gradient. Positive values in panels b) and c) imply that work is performed on the plasma, i.e., the kinetic energy of the plasma is enhanced. All values represent averages in a box spanning 2 Mm × 2 Mm horizontally and 1 Mm in height (cf. red box in right panels of Fig. 1).
Current usage metrics show cumulative count of Article Views (full-text article views including HTML views, PDF and ePub downloads, according to the available data) and Abstracts Views on Vision4Press platform.
Data correspond to usage on the plateform after 2015. The current usage metrics is available 48-96 hours after online publication and is updated daily on week days.
Initial download of the metrics may take a while.