Free Access
Fig. 2
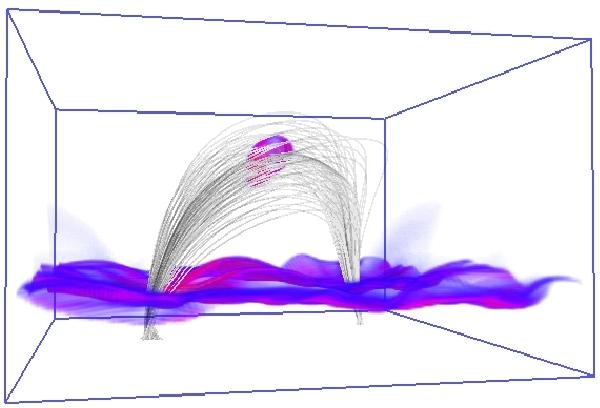
Coronal box as seen in O vi (1032 Å) synthesized from 3D MHD model (emission increases from blue over violet to red). Overplotted are the magnetic field lines that cover the trajectory of the ejection (snapshot at 45 min). Visualization using VAPOR (Clyne & Rast 2005; Clyne et al. 2007).
Current usage metrics show cumulative count of Article Views (full-text article views including HTML views, PDF and ePub downloads, according to the available data) and Abstracts Views on Vision4Press platform.
Data correspond to usage on the plateform after 2015. The current usage metrics is available 48-96 hours after online publication and is updated daily on week days.
Initial download of the metrics may take a while.