Fig. A.1
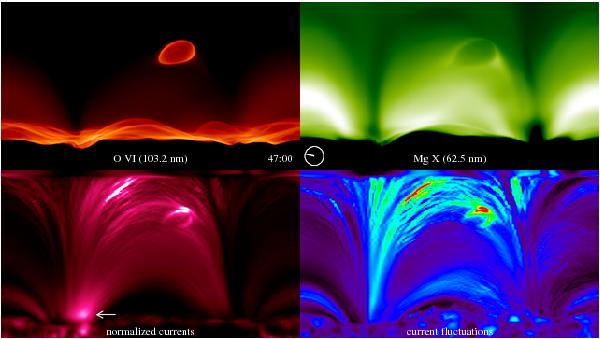
Side view of the 3D computational box showing the synthesized emission in O vi and Mg x (top row), the normalized currents  and the current fluctuations
  (bottom row; see Eqs. (A.1) and (A.2) and Appendix A for details). Each panel covers 50 Mm in the horizontal and 30 Mm in the vertical direction. This snapshot shows the ejection at t = 47 min, i.e., at the same time as the middle row of Fig. 1 and as Fig. 9. The arrow points at the location of the high energy input that causes the ejection. A movie showing the temporal evolution over 1 h is available in the online edition. The movie is also available at http://www.mps.mpg.de/data/outgoing/peter/papers/plasma-ejection/blob.mpg (6 MB).
Current usage metrics show cumulative count of Article Views (full-text article views including HTML views, PDF and ePub downloads, according to the available data) and Abstracts Views on Vision4Press platform.
Data correspond to usage on the plateform after 2015. The current usage metrics is available 48-96 hours after online publication and is updated daily on week days.
Initial download of the metrics may take a while.