Fig. 1
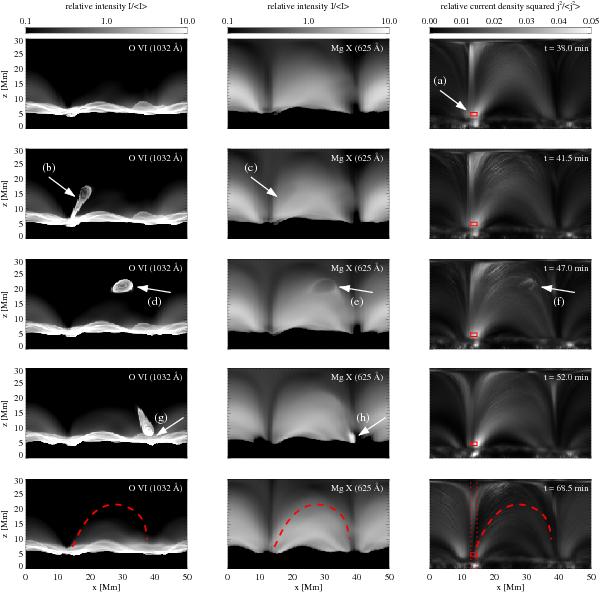
Evolution of the plasma ejection over 30 min (top to bottom, times noted in right panels). The left and middle panels show the (normalized) synthesized emission in O vi (1032 Å) and Mg x (625 Å) integrated horizontally through the computational box. This corresponds to what would be observed at the solar limb. The right panels show the currents, j2, i.e., the Ohmic heating rate, also integrated horizontally through the box. j2 is divided by the average trend with height to account for the roughly exponential decrease of the heating rate with height (cf. Bingert & Peter 2011). The arrows point to the same location in the maps in each row. The red line in the bottom row indicates the trajectory of the plasma eruption that was deduced from the position of its center of gravity (see Sect. 4.2). The red box in the j2-images shows the approximate formation region of the plasma eruption; the dotted lines indicate its extension in the x-direction. See also movie in Appendix A, Fig. A.1.
Current usage metrics show cumulative count of Article Views (full-text article views including HTML views, PDF and ePub downloads, according to the available data) and Abstracts Views on Vision4Press platform.
Data correspond to usage on the plateform after 2015. The current usage metrics is available 48-96 hours after online publication and is updated daily on week days.
Initial download of the metrics may take a while.