Free Access
Fig. 3
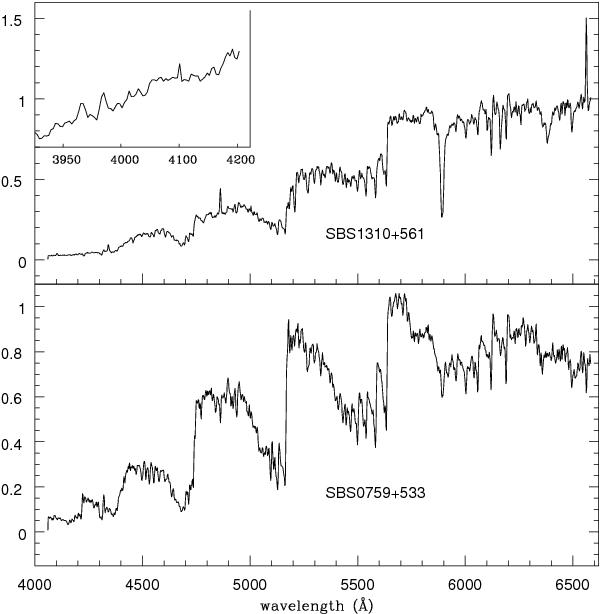
Medium-resolution spectra of the CH giant SBS 0759+533 and the dC SBS 1310+561. For this star an enlargment of the region 3900 − 4200 Å from the lower resolution spectrum is plotted to emphasize Hδ and the CaII emissions, which are not covered by the grism #7 spectral range. Ordinates are the same as in Fig. 1.
Current usage metrics show cumulative count of Article Views (full-text article views including HTML views, PDF and ePub downloads, according to the available data) and Abstracts Views on Vision4Press platform.
Data correspond to usage on the plateform after 2015. The current usage metrics is available 48-96 hours after online publication and is updated daily on week days.
Initial download of the metrics may take a while.