Fig. 3
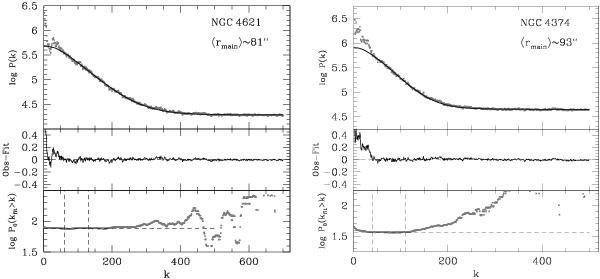
Power spectrum analysis of the main annuli for both targets. Left panels: NGC 4621 analysis. The upper panel shows the logarithm of the power spectrum of the residual frame (grey dots) and the best-fit P(k) curve (black solid line). In middle panel the difference between observed and fitted data is shown. The flat region of log P0(kfit > k) between vertical dashed lines in the lower panel is used to evaluate the best-fit parameters P0, and P1 (Cantiello et al. 2005; Biscardi et al. 2008). Right panels: as left, but for NGC 4374.
Current usage metrics show cumulative count of Article Views (full-text article views including HTML views, PDF and ePub downloads, according to the available data) and Abstracts Views on Vision4Press platform.
Data correspond to usage on the plateform after 2015. The current usage metrics is available 48-96 hours after online publication and is updated daily on week days.
Initial download of the metrics may take a while.