Fig. 8
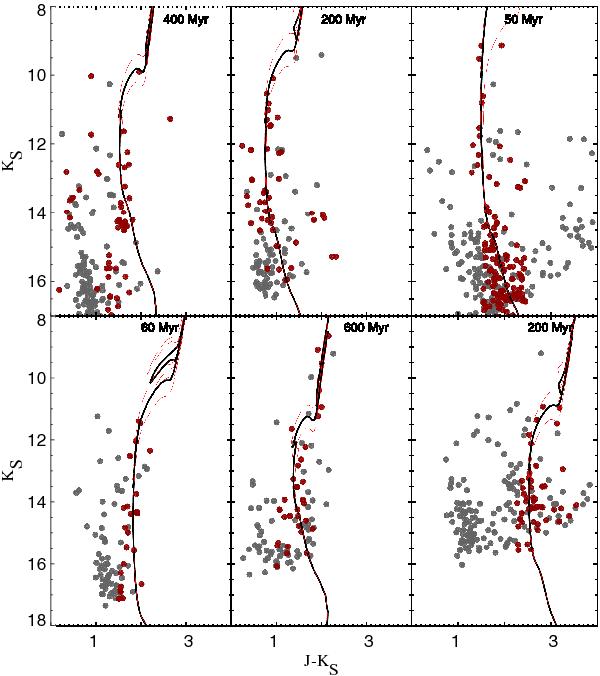
VVV CMDs of (from upper left to bottom right) VVV CL008, VVV CL009, VVV CL039, VVV CL047, VVV CL070, VVV CL095. The statistically decontaminated CMDs are shown as red filled circles, the comparison field as gray filled circles. The best isochrone fit (Girardi et al. 2010) is plotted as a solid line, while the dotted lines represent the closest younger and older solutions.
Current usage metrics show cumulative count of Article Views (full-text article views including HTML views, PDF and ePub downloads, according to the available data) and Abstracts Views on Vision4Press platform.
Data correspond to usage on the plateform after 2015. The current usage metrics is available 48-96 hours after online publication and is updated daily on week days.
Initial download of the metrics may take a while.