Fig. 7
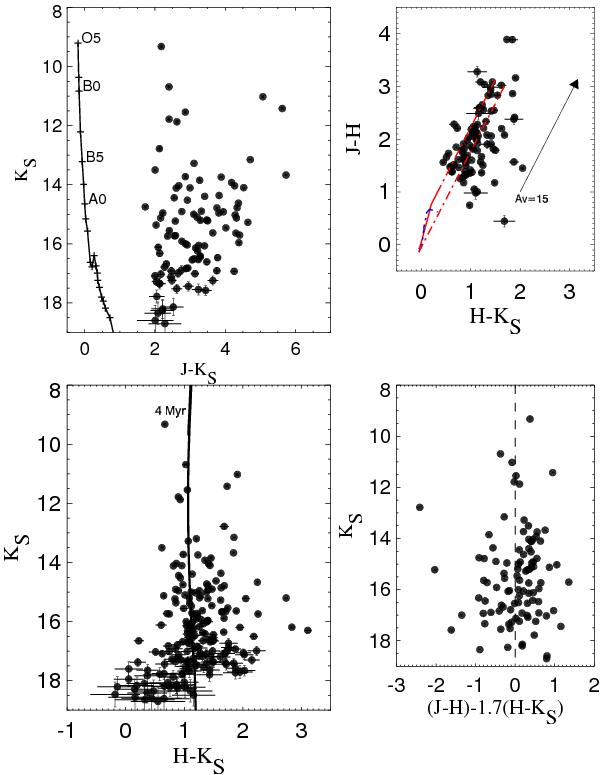
VVV observed CMDs extracted from the  region of VVV CL062. The top-left panel shows statistically decontaminated most probable cluster members with the Schmidt-Kaler (1982) sequence in the (J − KS) vs. KS diagram. The top-right panel gives (J − H) vs. (H − KS) color–color diagram. The continuous lines represents the sequence of the zero-reddening stars of luminosity class i (Koornneef 1983) and class v (Schmidt-Kaler 1982). The reddening vector for AV = 15 mag is overplotted and the dotted lines are parallel to the standard reddening vector. The bottom-left panel shows the (H − KS) vs. KS color–magnitude diagram with a 4 Myr isochrone from Girardi et al. (2010). In the bottom-right panel the reddening free color of (J − H) − 1.70(H − KS) is plotted vs. KS magnitude.
Current usage metrics show cumulative count of Article Views (full-text article views including HTML views, PDF and ePub downloads, according to the available data) and Abstracts Views on Vision4Press platform.
Data correspond to usage on the plateform after 2015. The current usage metrics is available 48-96 hours after online publication and is updated daily on week days.
Initial download of the metrics may take a while.