Free Access
Fig. 10
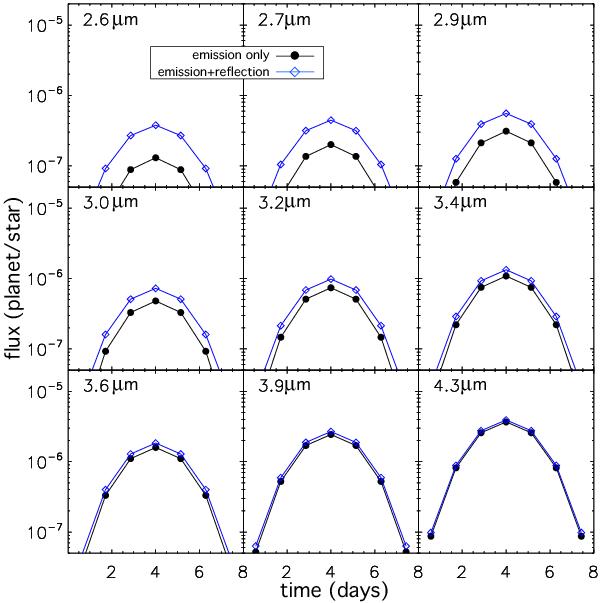
Contribution of the reflected light to the phase curve with no atmosphere. The 7-point phase curves are computed with emission only (black circles) and with emission+reflection (diamonds). Band central wavelengths are indicated in the upper left corner of each plot.
Current usage metrics show cumulative count of Article Views (full-text article views including HTML views, PDF and ePub downloads, according to the available data) and Abstracts Views on Vision4Press platform.
Data correspond to usage on the plateform after 2015. The current usage metrics is available 48-96 hours after online publication and is updated daily on week days.
Initial download of the metrics may take a while.