Fig. 9
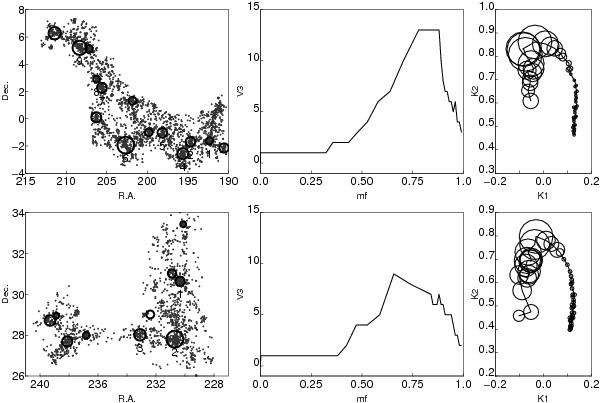
Left panels: the distribution of galaxies (grey dots) in the sky, for the two superclusters, SCl 061 (upper row) and SCl 094 (lower row). Circles mark the location of groups with at least 30 member galaxies, and the size of a circle is proportional to the size of a group in the sky. The numbers show Abell clusters. The middle panels show the fourth Minkowski functional V3, and the right panels the shapefinders K1 (planarity) and K2 (filamentarity) for a supercluster. The morphological signature in the K1 − K2 plane is parametrically defined as K1(mf) and K2(mf). The sizes of open circles are proportional to the value of V3 at a given mass fraction mf. They show the change of the clumpiness with the mass fraction together with the changes in the morphological signature. The Abell clusters in the supercluster SCl 061 (upper row) are 1 – A1620, 2 – A1650, 3 – A1658, 4 – 1663, 5 – 1682, 6 – 1750, 7 – 1773, 8 – 1780, and 9 – 1809. The Abell clusters in the supercluster SCl 094 (lower row) are 1 – A2067, 2 – A2065, and 3 – A2089.
Current usage metrics show cumulative count of Article Views (full-text article views including HTML views, PDF and ePub downloads, according to the available data) and Abstracts Views on Vision4Press platform.
Data correspond to usage on the plateform after 2015. The current usage metrics is available 48-96 hours after online publication and is updated daily on week days.
Initial download of the metrics may take a while.