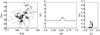
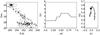
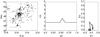
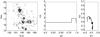
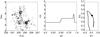
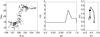
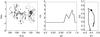
Fig. D.1
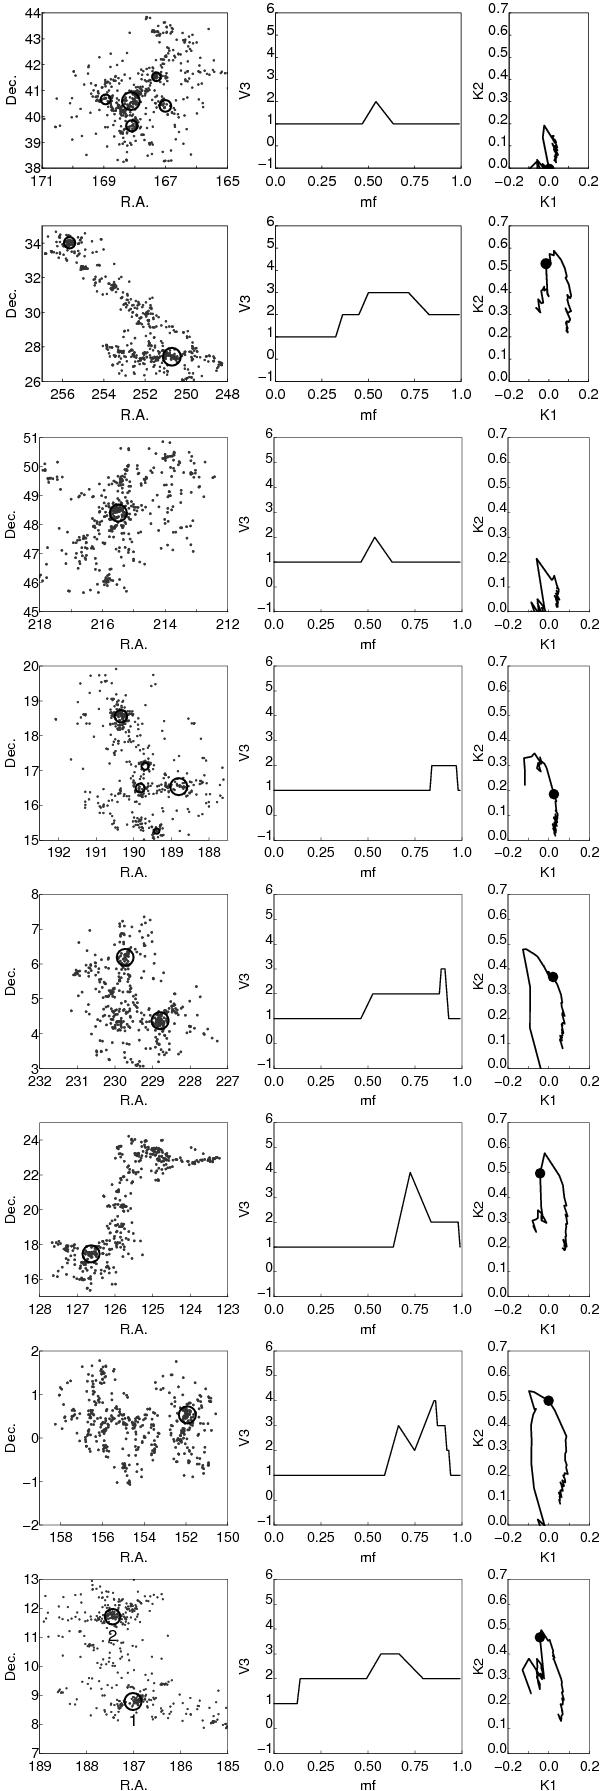
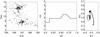
Left panels show the distribution of galaxies (dots) in the sky. Circles mark the location of groups with at least 30 member galaxies, and the size of a circle is proportional to the size of a group in the sky. The middle panels show the fourth Minkowski functional V3 vs. the mass fraction mf, and the right panels show the shapefinders K1 (planarity) and K2 (filamentarity) (the morphological signature). In the right panels filled circles mark the value of the mass fraction mf = 0.7; the mass fraction increases anti-clockwise along the curves. From top to bottom: the superclusters SCl 038, SCl 064, SCl 087, SCl 136, SCl 152, SCl 189, SCl 198, and SCl 223.
Current usage metrics show cumulative count of Article Views (full-text article views including HTML views, PDF and ePub downloads, according to the available data) and Abstracts Views on Vision4Press platform.
Data correspond to usage on the plateform after 2015. The current usage metrics is available 48-96 hours after online publication and is updated daily on week days.
Initial download of the metrics may take a while.